Replacing intuition with objectivity
Overcoming the limits of stock-level analysis when the entire market is in freefall.
The problem with conventional top-down analysis
- In broad market crashes, even strong fundamental analysis becomes irrelevant
- Human intuition distorts at peak fear — leading to systematic timing errors
- Simple indicator aggregation causes signal interference and double-counting
What the Regime Engine solves
- Classifies the current market as risk-accumulating, fracturing, or stable — enabling precise asset allocation
- Clusters correlated indicators into blocks; uses representative values with dynamically-weighted regime calls
- A forced circuit-breaker activates when risk crosses critical thresholds — setting a hard floor on exposure
Engine Architecture
How 7 macro variables flow through system filters and convert into a 6-stage regime matrix.
Seven Indicators. Three Blocks.
Designed with built-in conditional weighting — not simple aggregation.
Sentiment & Liquidity
Tracks fear extremes and the direction of global capital flows into US markets. Detects short-term, high-velocity risk signals before they appear in price.
Credit & Rates
Monitors corporate funding stress and the health of the yield curve structure. Detects genuine fractures in the market's internal scaffolding before they become visible.
Macro Fundamentals
Reflects employment and inflation dynamics. Captures heavy, structural signals that take longer to reverse — the kind that cause prolonged bear markets rather than sharp corrections.
26-Year Full Backtest Results
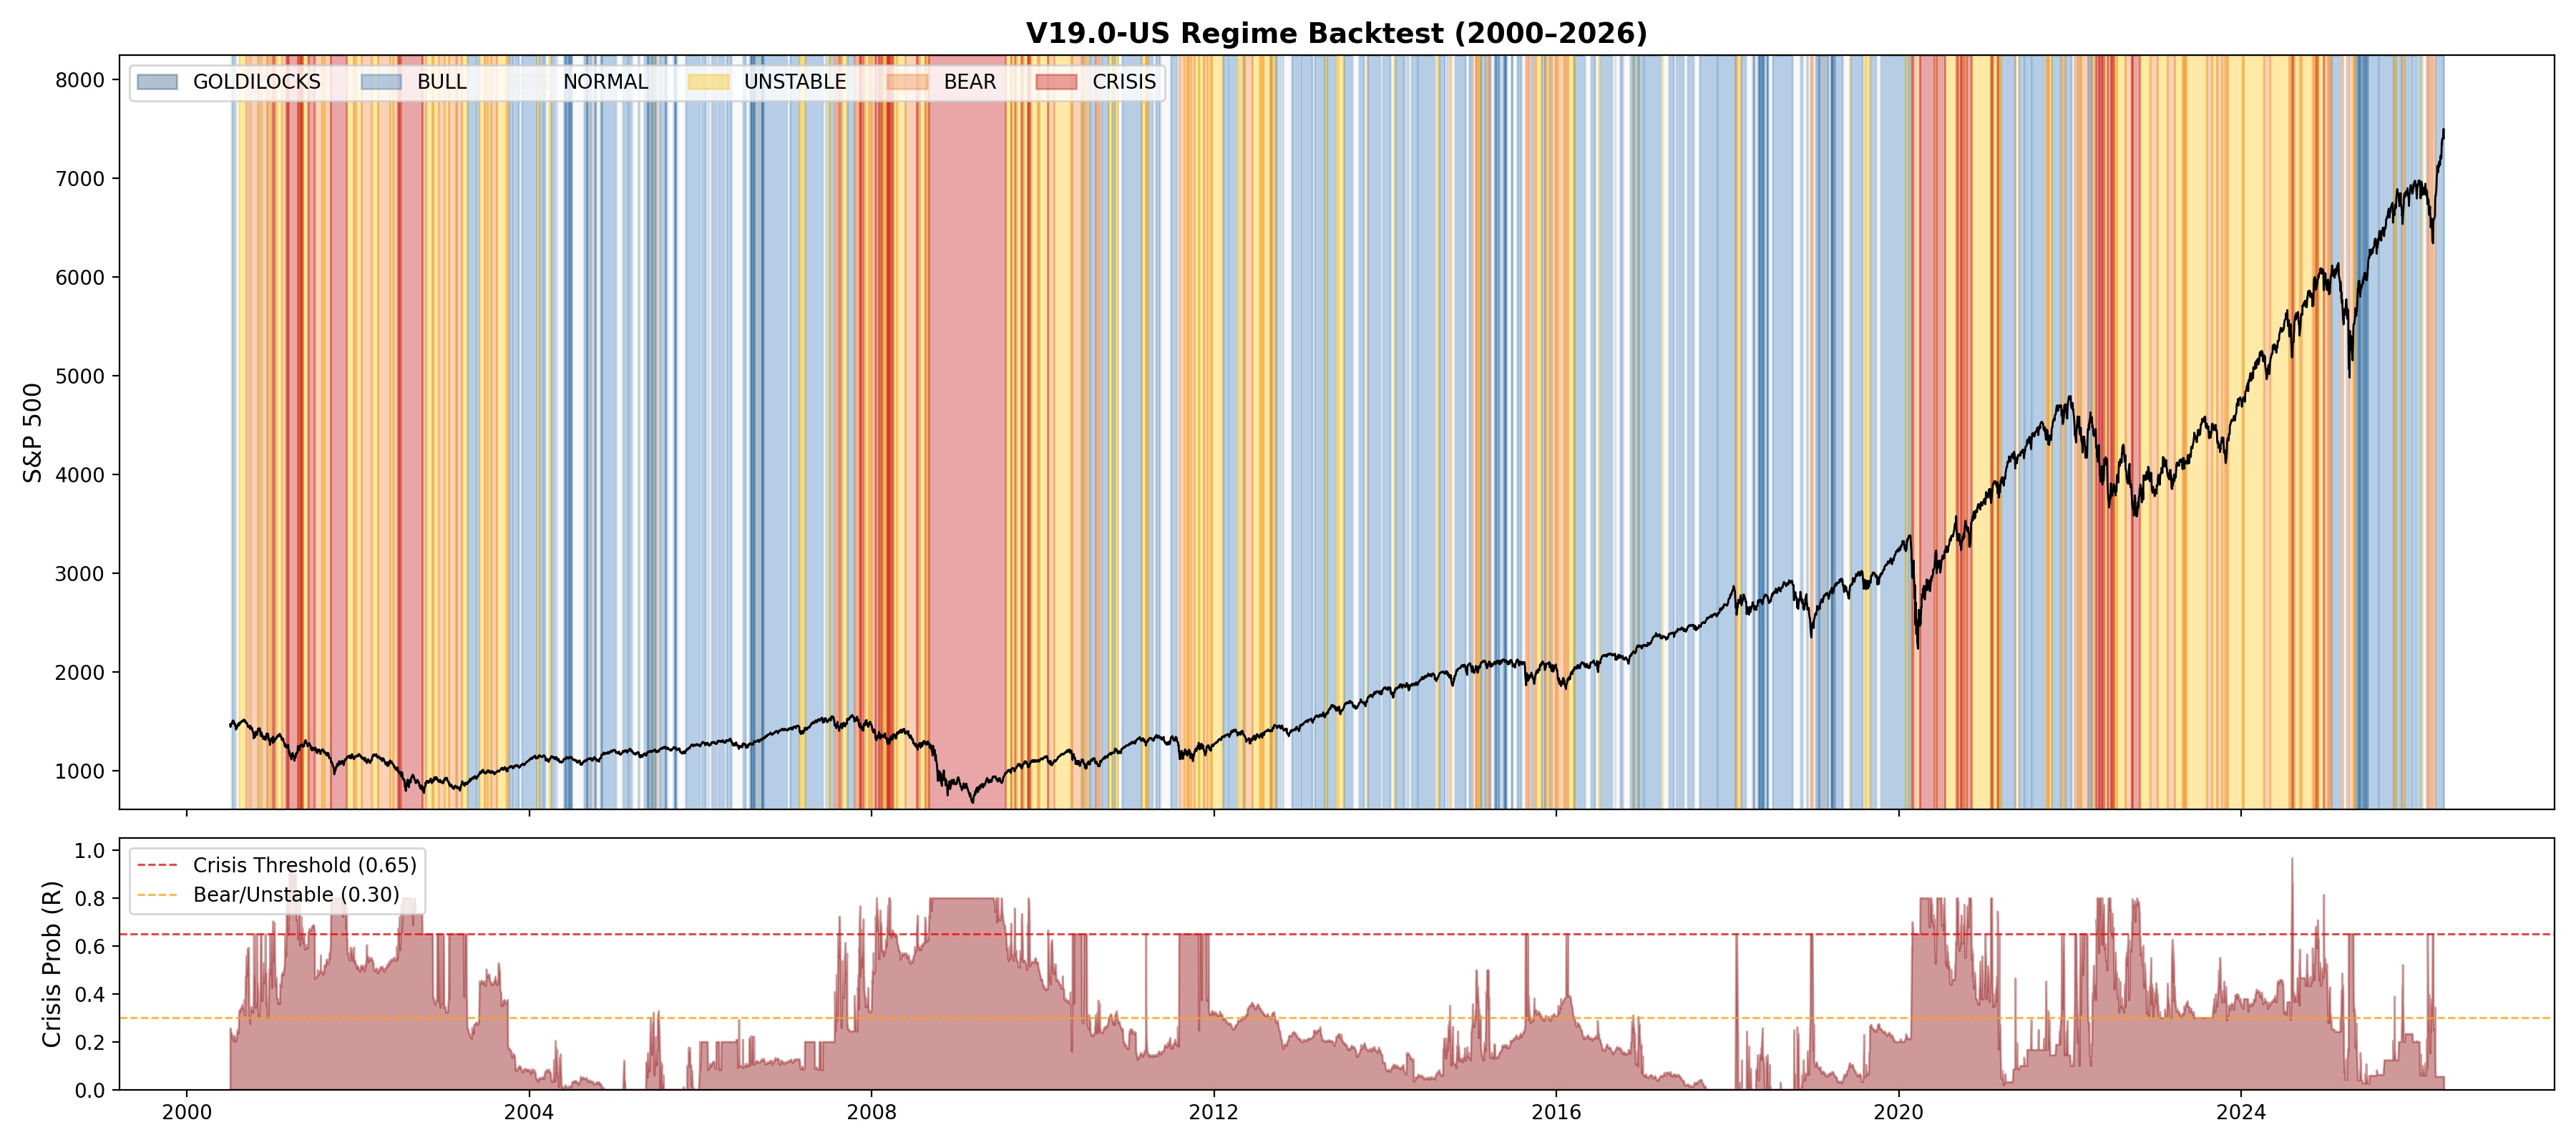
~6,600 trading days of data run through the engine. This is the actual regime classification record.
Historical Crisis Period Mapping
- Dot-com bubble and financial crisis: Major crisis regimes captured with no gaps in coverage
- 2020 COVID crash: The brief, violent V-shape shock correctly reflected as a narrow crisis window
- 2022 inflation bear market: Correctly classified as a prolonged bear, not a systemic crisis
Short-Term Regime Shift Sensitivity
- Mid-bull signals are not noise — they represent genuine risk variance periods within uptrends.
- 2015–16 yuan shock, Q4 2018 rate selloff, August 2024 yen carry unwind — all captured as trend deviations
- Long-term crisis defense and short-term volatility response are deliberately balanced — sensitivity is precisely calibrated
Regime Classification Matrix
The 6-stage system regime derived from the engine's crisis probability (R), volatility, and technical position.

| Regime | Market State & Definition | Risk Control Posture |
|---|---|---|
| GOLDILOCKS | Maximum macro stability; volatility suppressed | Risk premium removed; maximum allocation justified |
| BULL | Strong upward momentum driven by sentiment and liquidity | Maintain trend-following; maximize position intensity |
| NORMAL | No unusual risk; range-bound or gradual drift | Standard cash allocation; focus on individual fundamentals |
| UNSTABLE | Short-term volatility spike; partial macro warning signals | Reduce new entry weight; heighten risk monitoring |
| BEAR | Structural credit/rate stress accumulating; downtrend established | Conservative positioning; gradual cash increase |
| CRISIS | Systemic risk threshold breached; circuit breaker activated | Capital preservation first; full defensive mode |